Live Operation
Data window: last 60 minutes
The Live Operation tab displays what is happening in your operation right now. All data reflects exclusively the last 60 minutes.
Production tasks
Tasks marked as test are not counted in the indicators and charts.
Summary Cards
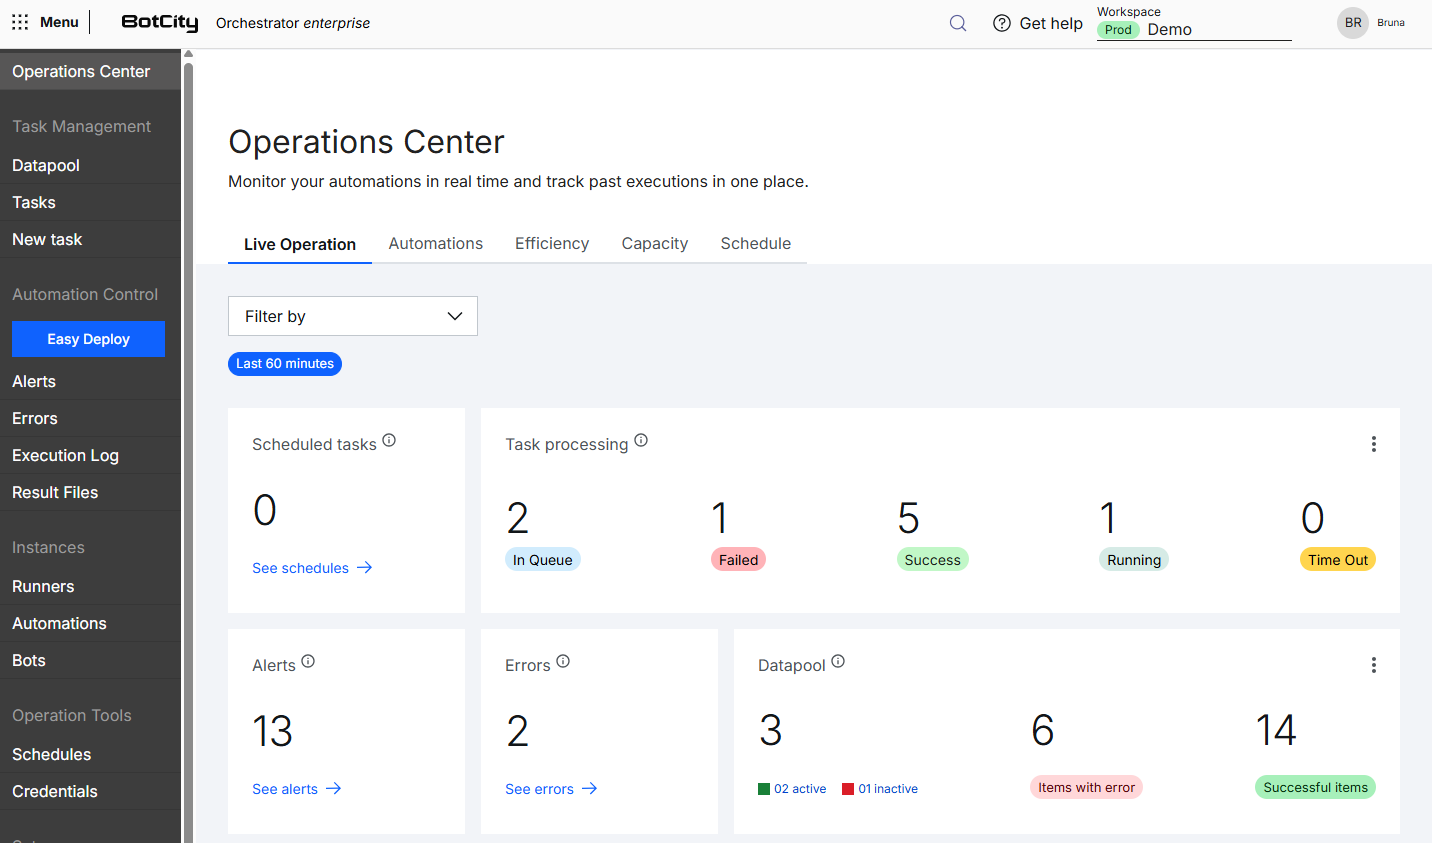
The cards at the top provide a quick reading of the main real-time indicators:
- Scheduled tasks: Number of scheduled tasks already finished.
See schedules: Link that directs to the Schedule tab of the Operations Center.
- Task processing: Summary of the task queue broken down by status:
In Queue: Number of tasks waiting for an available Runner to execute.Failed: Number of tasks that finished with a failure.Success: Number of tasks that finished successfully.Running: Number of tasks currently running.Timeout: Number of tasks running longer than expected.Options menu: Directs to the tasks menu in the Orchestrator.
- Alerts: Total number of alerts of any type triggered by all tasks executed in the period.
See alerts: Link that directs to the Orchestrator's alerts menu.
- Errors: Total number of errors triggered by all tasks executed in the period.
See errors: Link that directs to the Orchestrator's errors menu.
- Datapool: Summary of the Datapool feature
Datapool: Number of Datapools split by active and inactive.Items with error: Total items processed with errors.Successful items: Total items processed successfully.Options menu: Directs to the Datapool menu in the Orchestrator.
- Runner status: Table presenting a summary of the Runners.
Alerts and Errors
For Alerts and Errors to be counted, they need to be configured in the automations' code.
See more at:
Runners Table
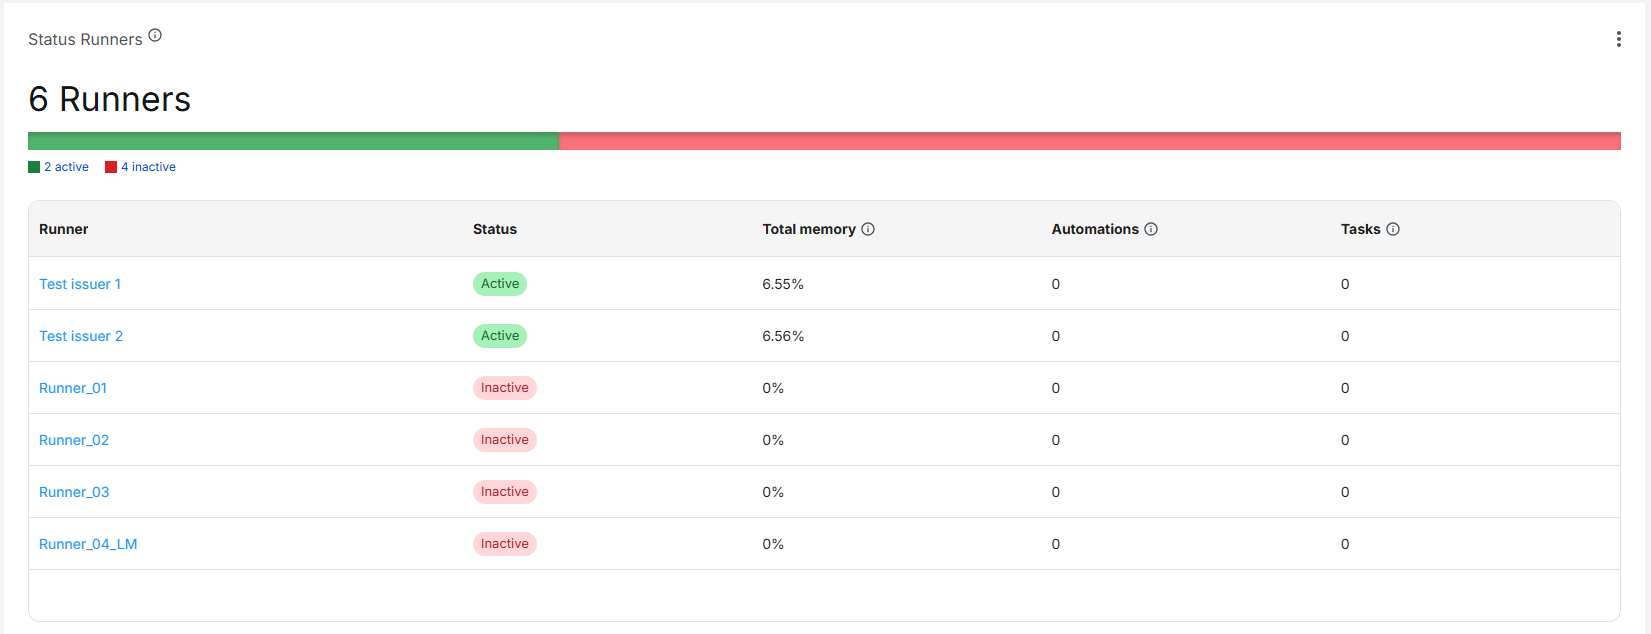
The Runners table displays a complete view of your infrastructure in real time. It shows the total number of available Runners at the top, along with a chart showing the number of active and inactive Runners.
You can see the columns:
- Runner: Runner name, clickable to access its details.
- Status:
activeorinactive. - Total memory: Percentage of memory used on the server where the Runner is running.
- Automations: Number of automations with tasks executed or running in the last 60 minutes.
- Tasks: Total tasks executed or running in the last 60 minutes.
Options menu: Available options:See Runner list: Directs to the Runners menu in the Orchestrator.Active Runners only: Filters the table to active Runners.Inactive Runners only: Filters the table to inactive Runners.
Runner configuration
The Total memory column only shows real values when the Runner is configured to send telemetry from the machine it's running on.
See more at:
Filters
You can combine several filters at the top of Live Operation to search according to your needs.
Available filters:
- Automation: Select one or more automations, with search available.
- Repository: Select a specific repository, with search available.
Filter persistence
Selected filters remain applied when navigating between the Operations Center tabs, preserving the context of your analysis.
Period
In the Live Operation tab, the searched period is always the last 60 minutes.