Schedule
The Schedule tab gives automation managers complete visibility into all schedules, past, current, and future, in a calendar interface, without needing to consult technical lists or external tools.
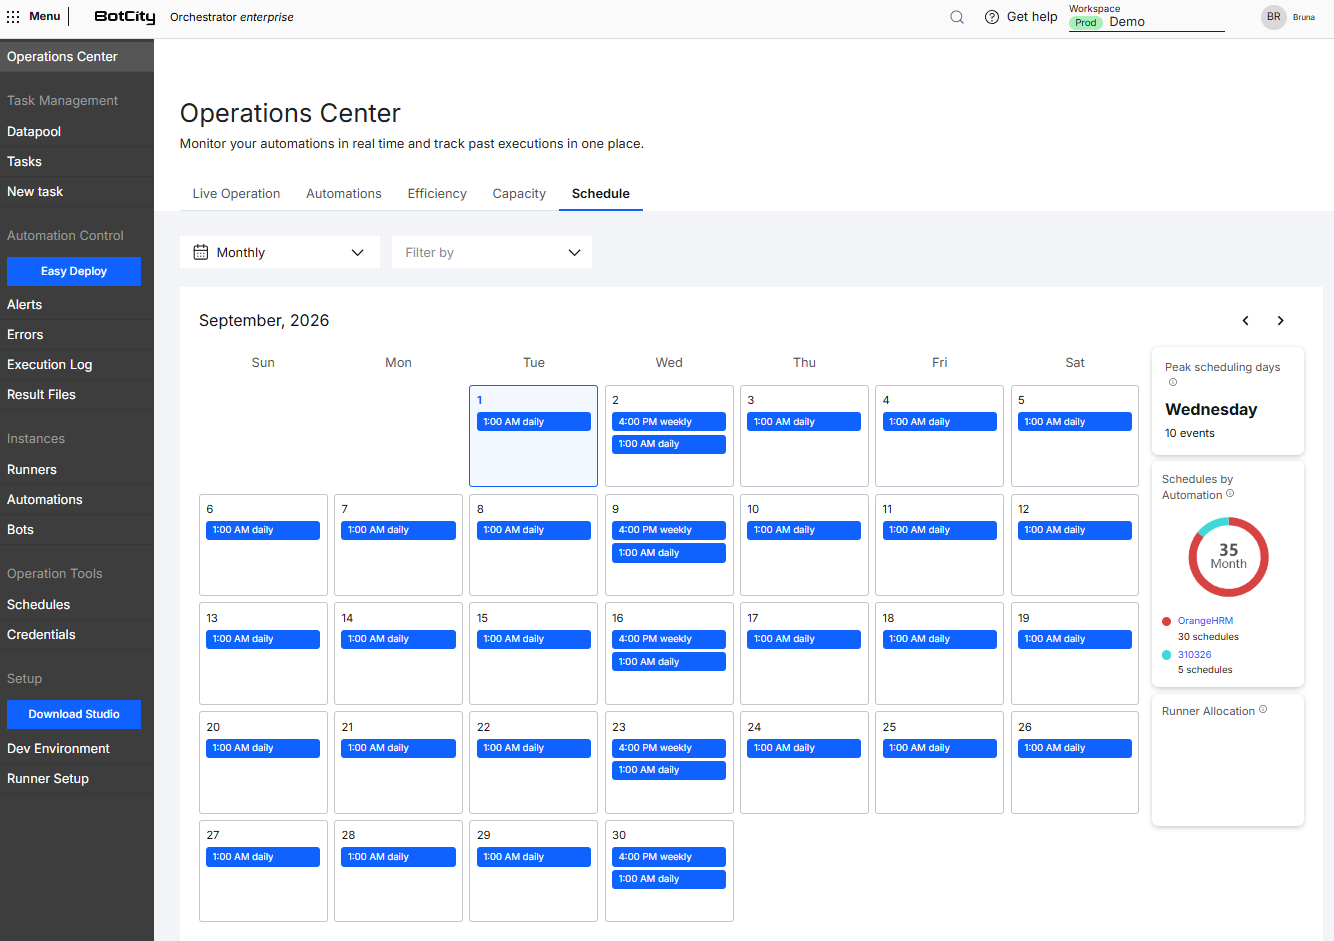
Calendar
The calendar is the central element of the tab, displaying schedules as cards distributed by day, with view options, navigation limits, and event detail to support monitoring the operation.
Available Views
A selector at the top of the calendar lets you switch between three views:
- Monthly
(default): Overview of the month, with cards grouped by hourly window. - Weekly: Detailed view of the week, with time-block layout.
- Daily: View of a single day, with all events expanded.
Navigation Limits
The calendar allows navigation:
- Past: Up to 6 months before the current date.
- Future: Up to 30 days ahead of the current date.
Days outside this range are disabled in the interface.
Calendar fill
The calendar only fills in days of the current month. Weekdays that belong to the following month are not populated with events.
Schedule Cards
Each event on the calendar is represented by a blue card with the time and the name of the schedule (e.g., 1:00 daily, 4:00 weekly).
Color semantics:
- Dark blue: Current or future events (scheduled or in progress).
- Light blue: Past events, regardless of the execution result.
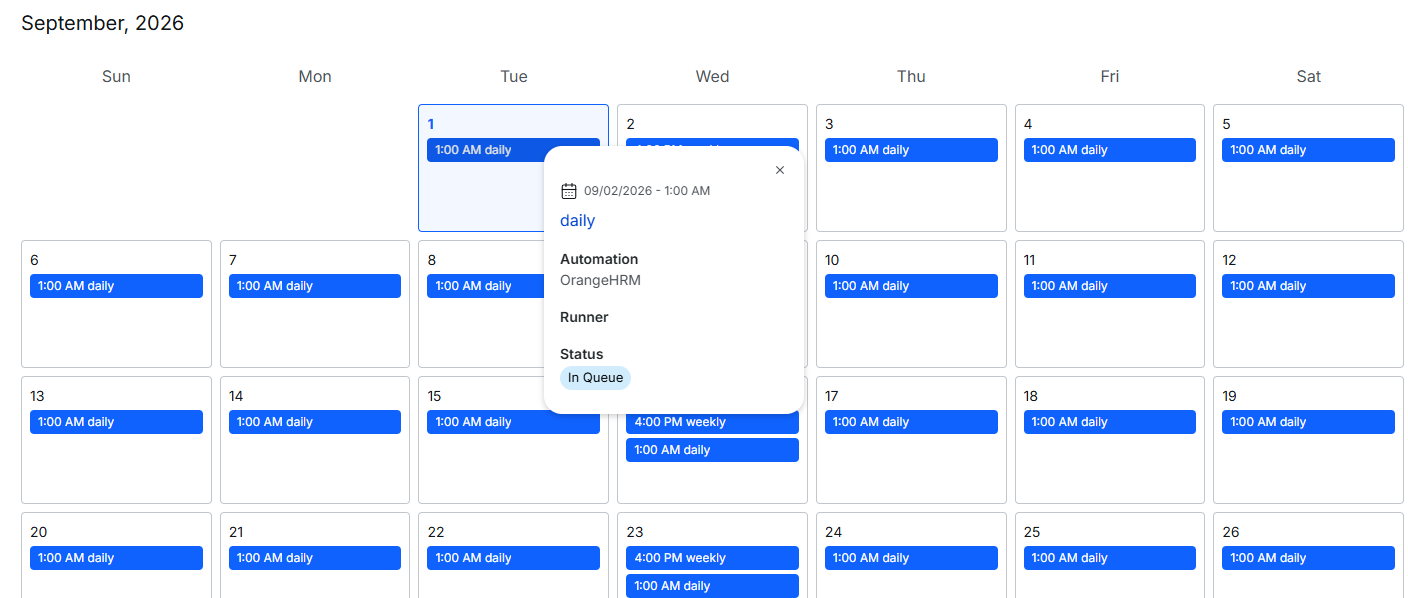
Hovering over or clicking a card shows a tooltip with details over the calendar, including:
- Date and time: Exact date of the schedule.
- Name: Name given to the schedule.
- Automation: Name of the linked automation.
- Runner: Runner associated with the execution; the field is empty while the task hasn't yet been assigned to a Runner.
- Status: The task's actual status at that moment.
Actual task status
The task's status is visible only in the tooltip, and does not appear on the card itself.
Status: Waiting, Running, Success, Failed, Partially Completed, Timeout, Canceled
Event Grouping
When there are more schedules than the active view can display at once, events are grouped differently:
- Monthly: Each day shows the first 2 schedule cards. You can view the next 5 events via the
+ eventslink at the bottom of the cell.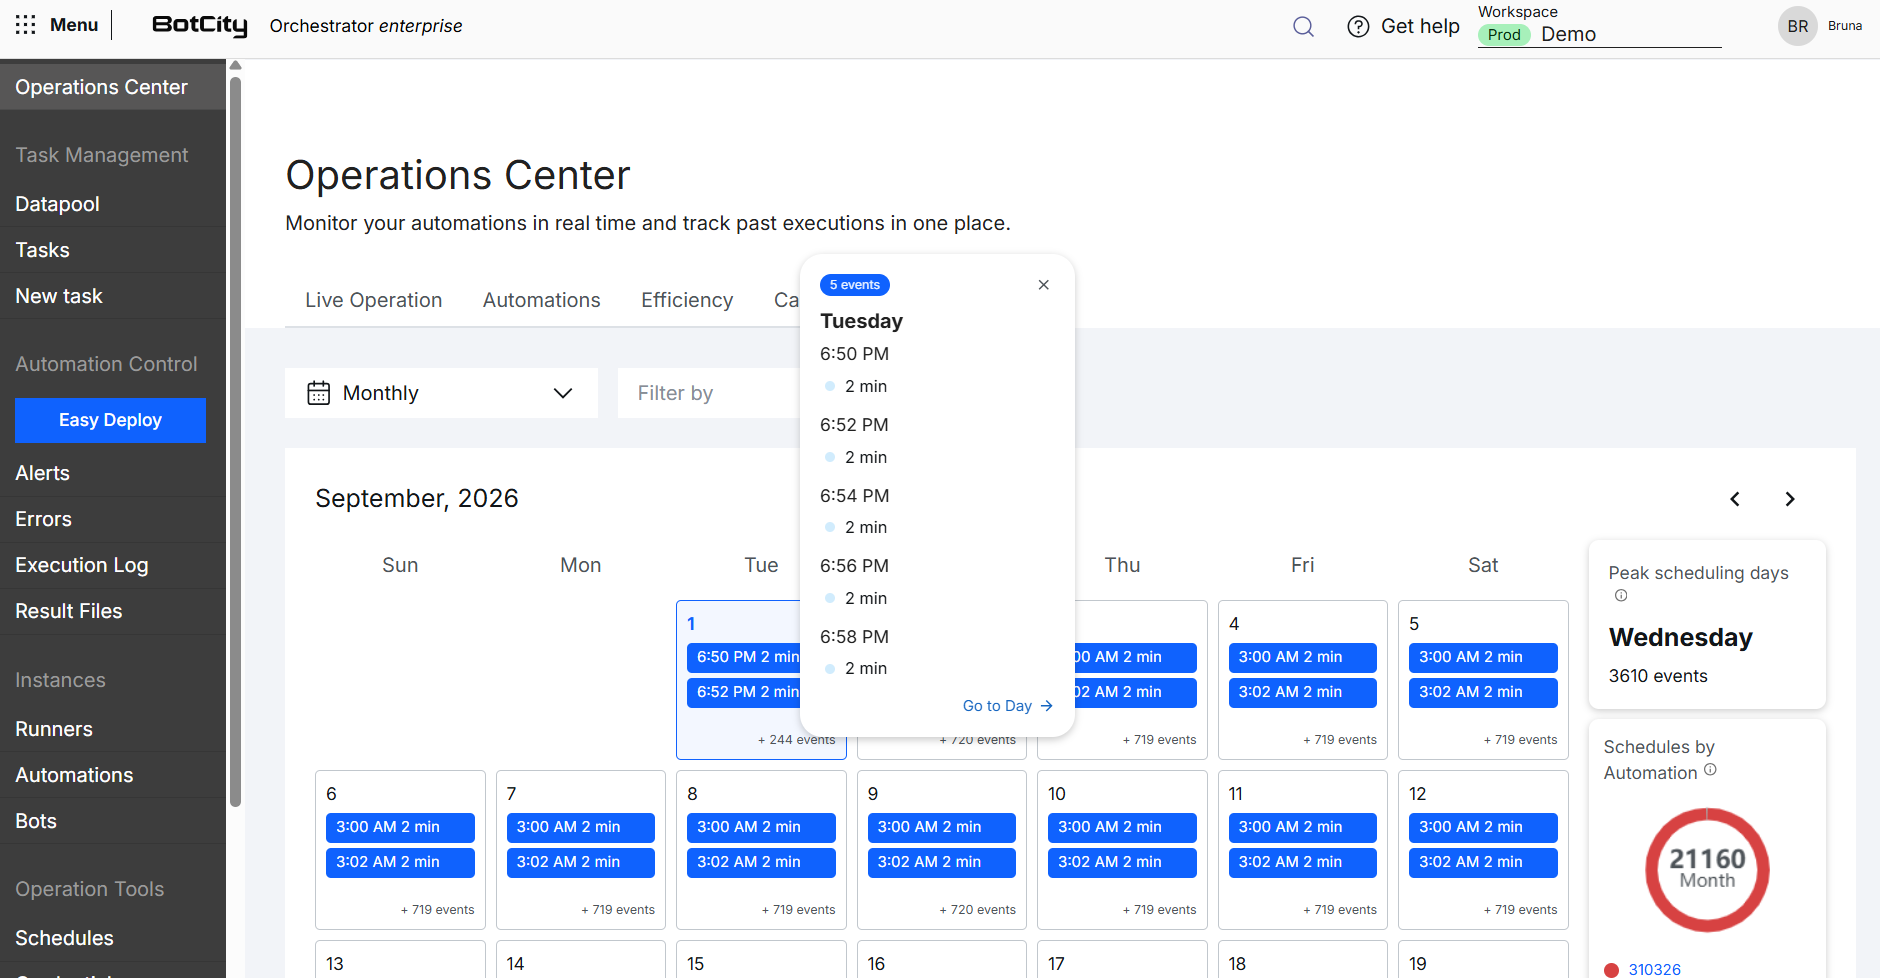
- Weekly: Each day shows the first 6 schedule cards. You can view the next 10 events via the
+ eventslink at the bottom of the column.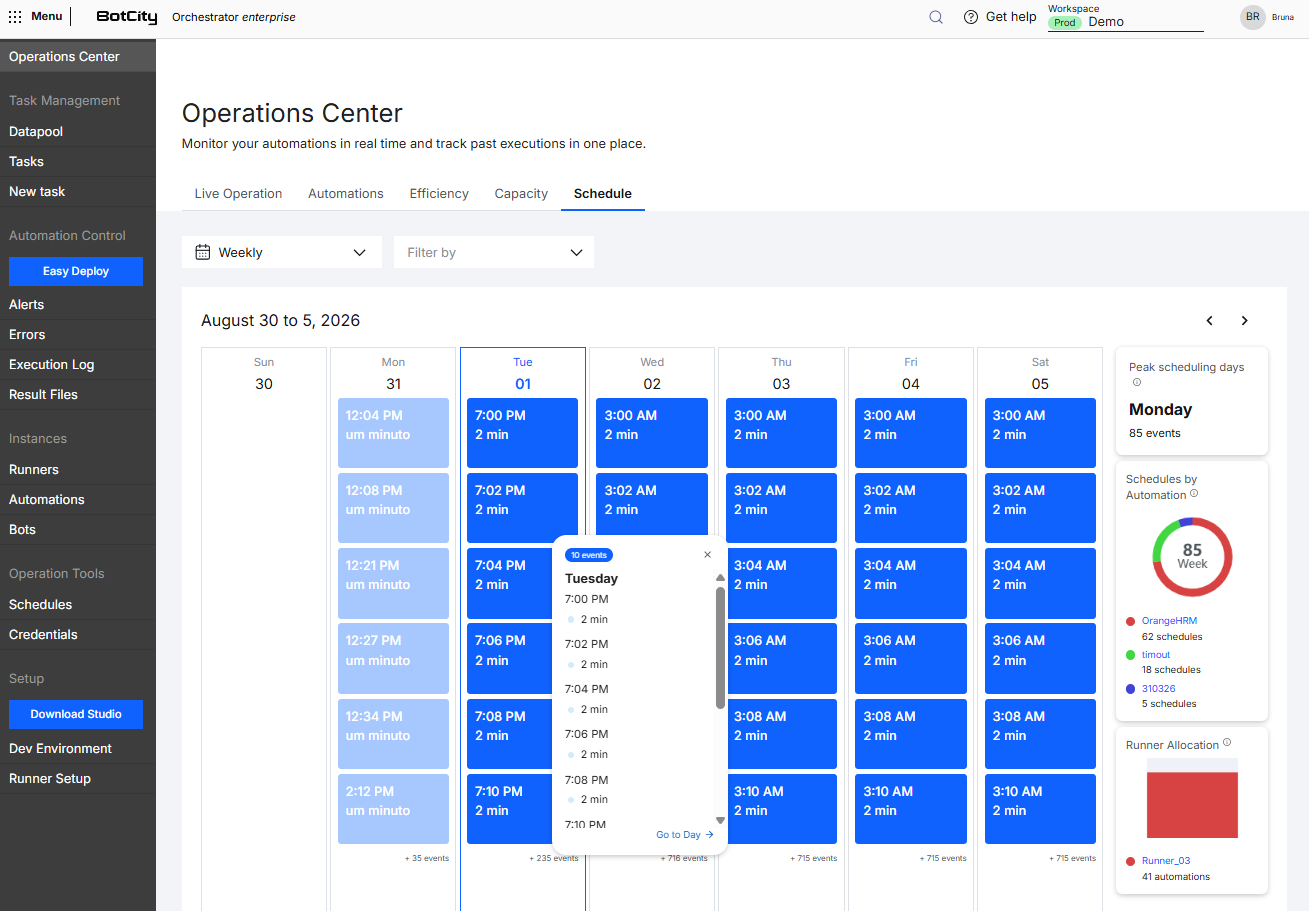
- Daily: Events are grouped by hour, shown as one bar per hour with the total events for that period. You can view the upcoming events on the hourly bar.
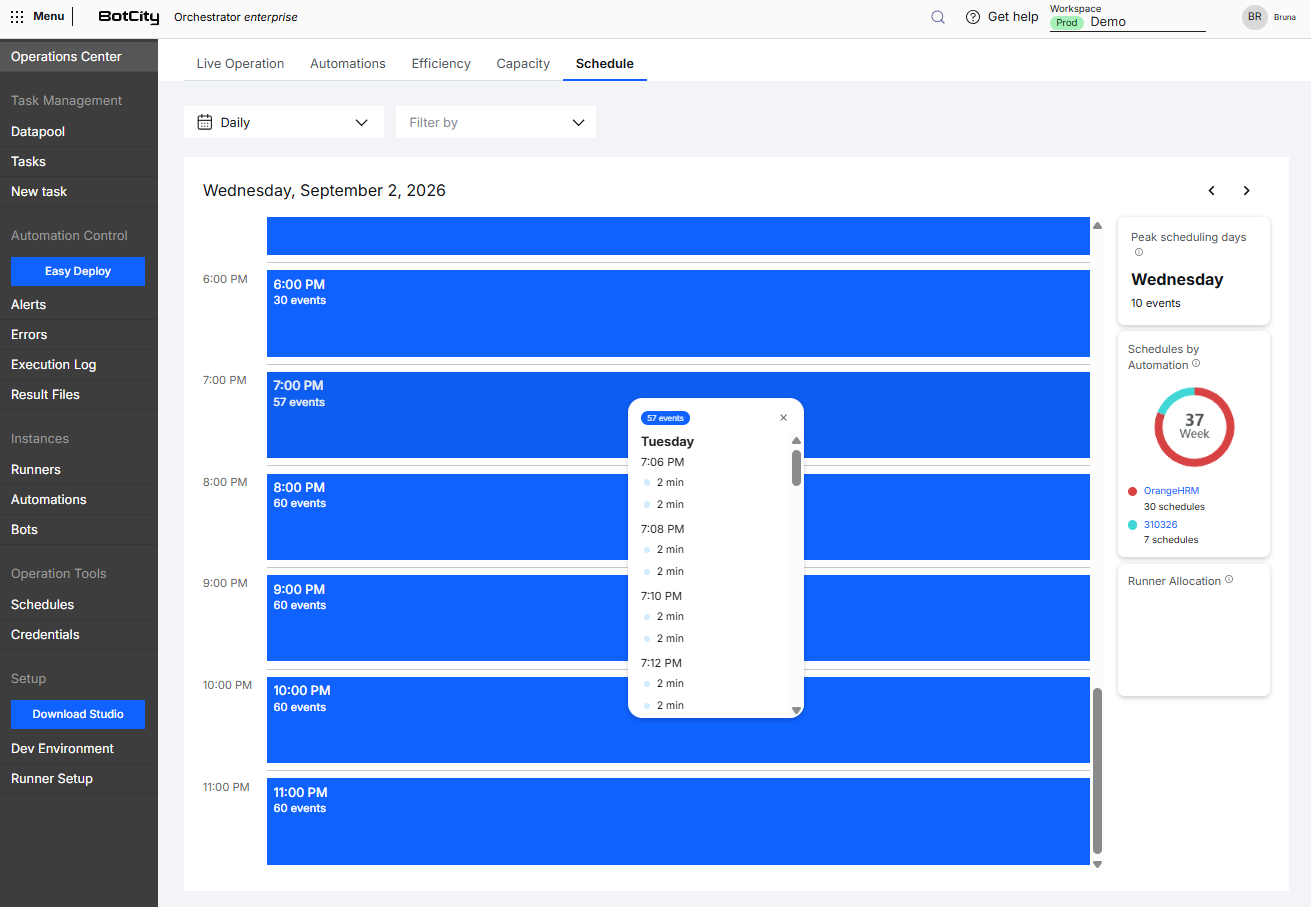
Clicking the + events link (monthly and weekly views) or an hourly bar (daily view) opens a popup with:
- A list with the time and name of the schedule.
- Each schedule with its status.
- Clicking the automation name may take you to:
Scheduled tasks: Schedule information page.Finished tasks: Corresponding task page.
Go to Day: Link that takes you directly to the day view for that date, from the monthly and weekly views.
Indicator Panel
The right sidebar displays intelligence cards about the schedules in the visible period:
- Peak scheduling days: Day of the week with the highest number of events projected from a schedule.
- Schedules by Automation: Donut chart with the total schedules for the month in the center and, below, a listing of the automations with the most schedules, each with a colored indicator and the number of schedules.
Automation name: Link that directs to the Schedule tab filtered by that automation.
- Runner Allocation: Stacked bar chart with the distribution of automations by Runner, with a listing below.
Runner name: Link that directs to the Runner's detail page with the list of associated automations.
Filters
You can combine several filters at the top of the Schedule tab to search according to your needs.
Available filters:
- View: Switches the calendar display between
Monthly(default),Weekly, andDaily. - Automation: Select one or more automations, with search available.
- Repository: Select a single repository, with search available.
Combining filters
The Automation and Repository filters are independent and can be combined. The selection applies to all calendar views.