Automations
The Automations tab provides the historical view of your automations' performance. With it, you can monitor the volume of tasks executed, understand how work is distributed across repositories and Runners, and identify performance variations over time.
Production tasks
Tasks marked as test are not counted in the indicators and charts.
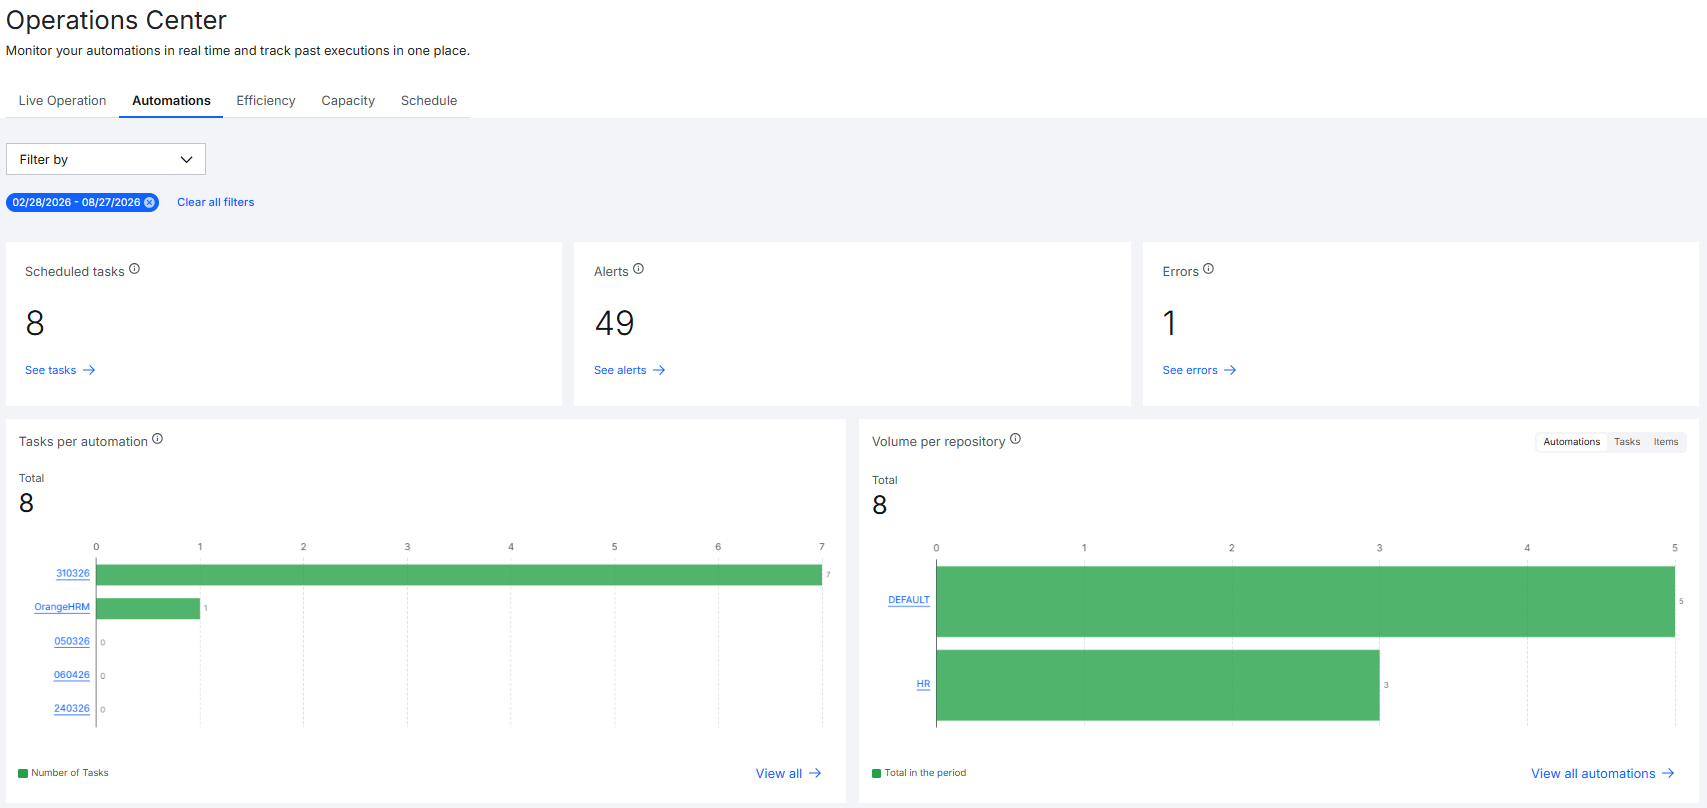
Summary Cards
The cards at the top provide a quick reading of the main indicators within the historical period:
- Scheduled tasks: Number of scheduled tasks already finished.
See tasks: Link that directs to the tasks menu in the Orchestrator.
- Alerts: Total number of alerts of any type triggered by all executed tasks.
See alerts: Link that directs to the Orchestrator's alerts menu.
- Errors: Total number of errors triggered by all executed tasks.
See errors: Link that directs to the Orchestrator's errors menu.
Charts
The tab's charts provide the historical view of automation performance in the selected period, cross-referencing task volume with automation, repository, and Runner to support trend analysis and the identification of deviations.
Exact values
Hovering over the bars shows a tooltip with the exact values.
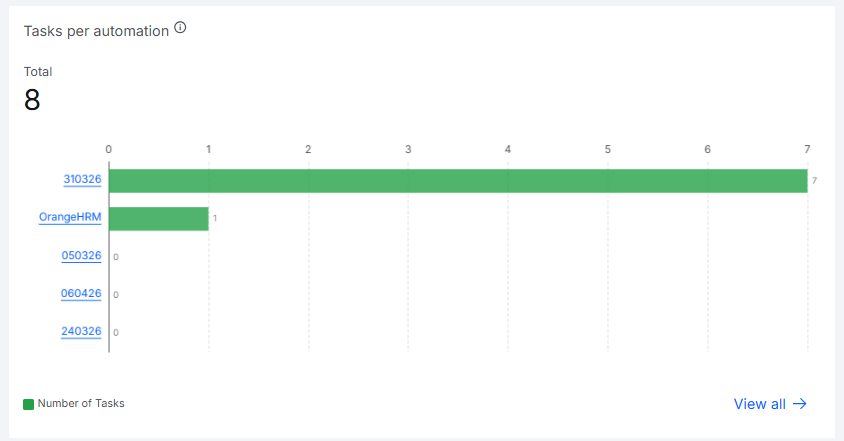
Tasks per automation
Shows the total tasks in the selected period.
Below the indicator, a horizontal bar chart shows the top 5 automations with the highest volume of tasks executed, ordered from most to least active. Useful for understanding which automations are the most active and identifying discrepancies from what's expected.
Automation name: Link that directs to the tasks menu filtered by the automation.See all tasks: Link that directs to the tasks menu in the Orchestrator.
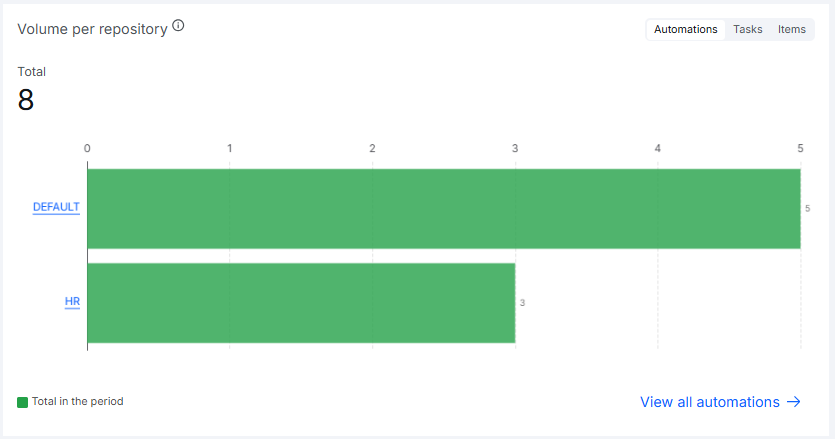
Volume per repository
Shows the total for the selected period, with buttons to switch the metric between:
- Automations: Repositories with the highest number of automations.
- Tasks: Repositories with the highest number of tasks finished successfully or partially completed.
- Items: Repositories with the highest number of items processed successfully.
Below the indicator, a horizontal bar chart shows the top 5 repositories according to the selected metric, making it easier to analyze performance by team or project, especially in operations with multiple teams.
Repository name: Link that directs to the automations menu filtered by the repository.See all automations: Link that directs to the automations menu in the Orchestrator.
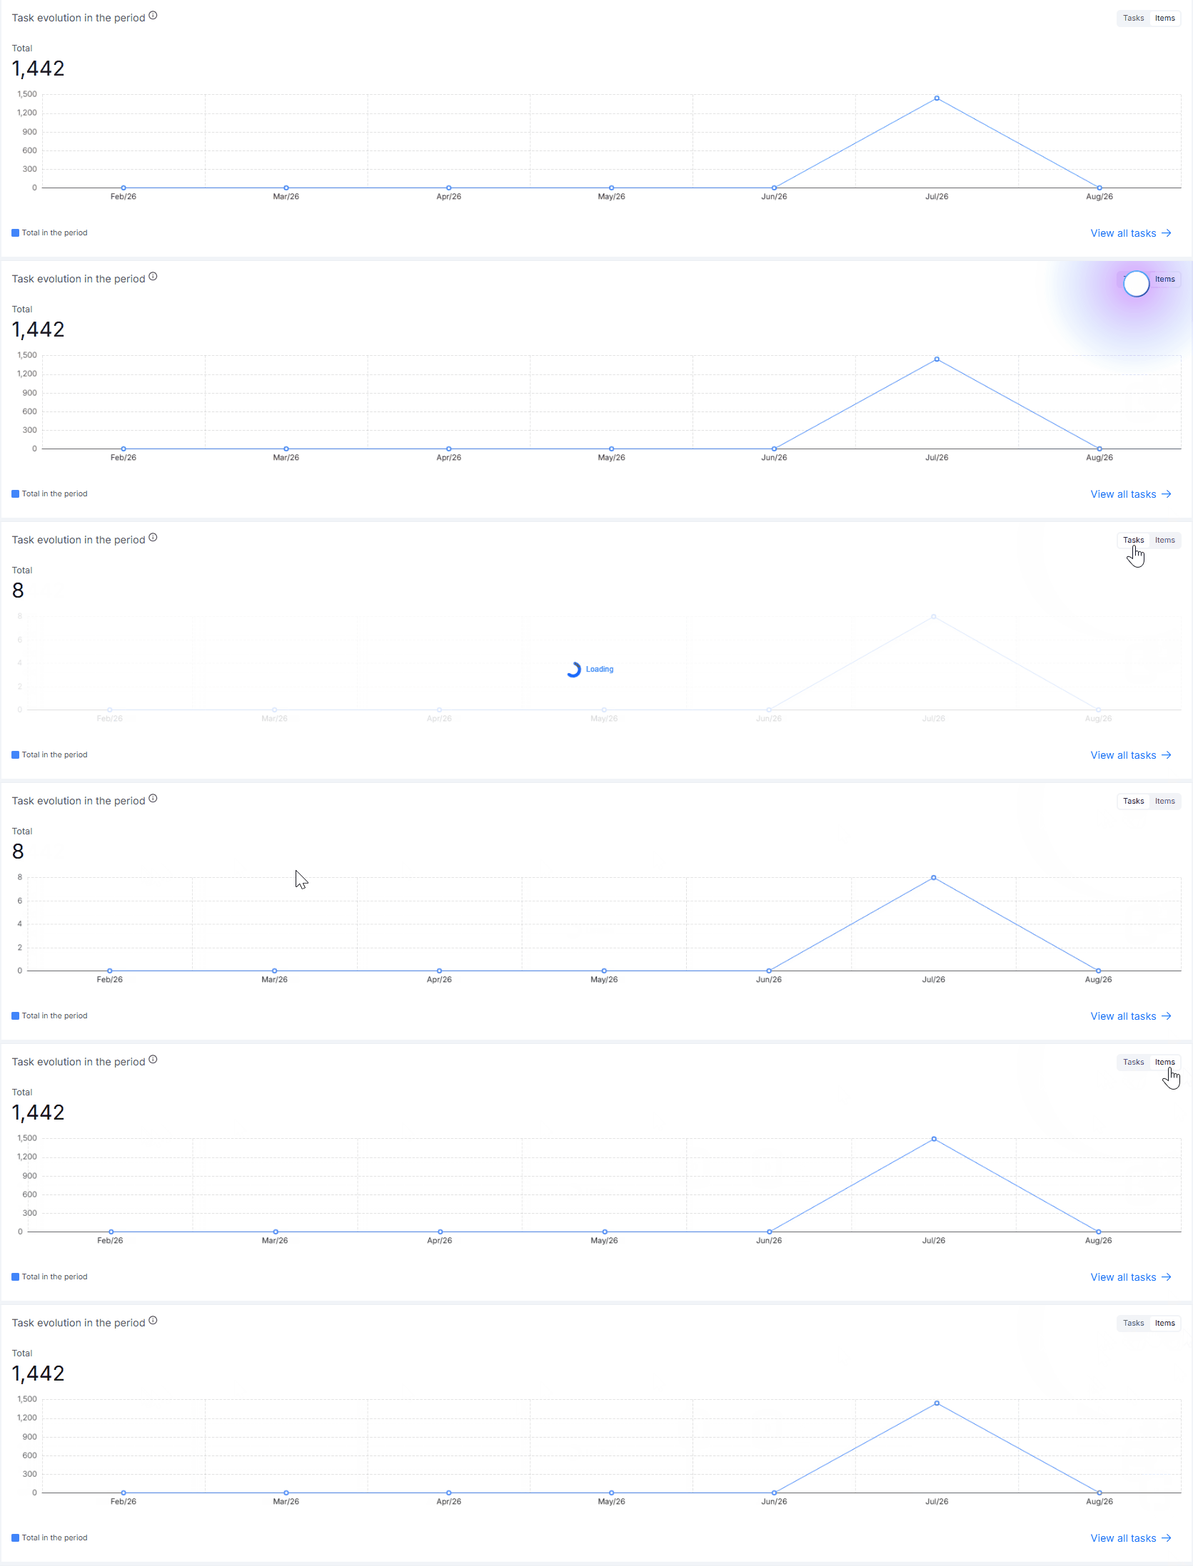
Task evolution in the period
Shows the total for the selected period, with buttons to switch the metric between:
- Tasks: Number of tasks finished successfully or partially completed.
- Items: Number of items processed successfully.
Below the indicator, a line chart shows the evolution of executions throughout the selected period, considering only tasks with the Success and Partially Completed statuses. Focusing on positive statuses allows you to track the operation's delivery trend without the noise of failures.
See all tasks: Link that directs to the tasks menu in the Orchestrator.
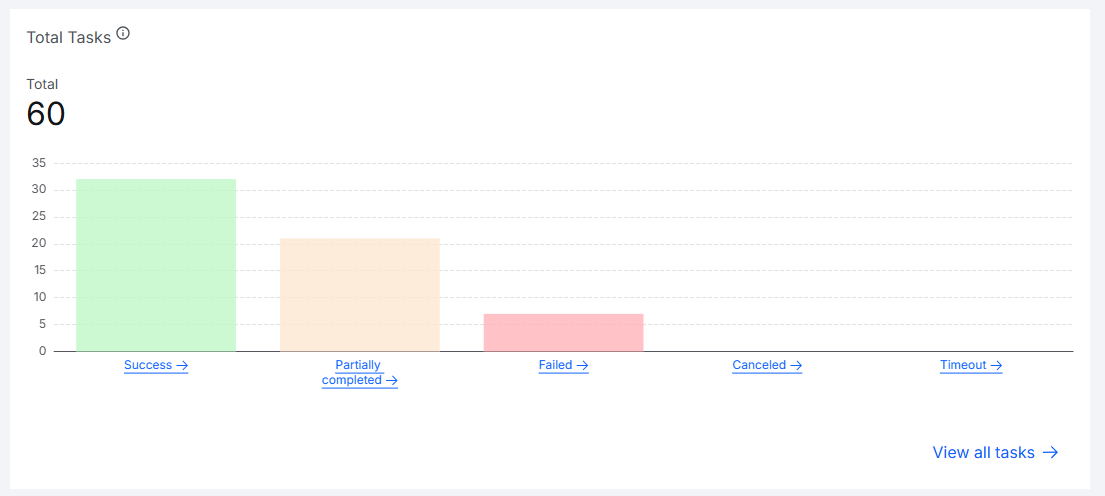
Total Tasks
Distributes the total tasks for the period across the possible completion statuses:
- Success: Tasks finished successfully.
- Partially Completed: Partially completed tasks.
- Failed: Tasks that failed.
- Canceled: Canceled tasks.
-
Timeout: Tasks that timed out.
-
Status name: Link that directs to the tasks menu filtered by that status. See all tasks: Link that directs to the tasks menu in the Orchestrator.
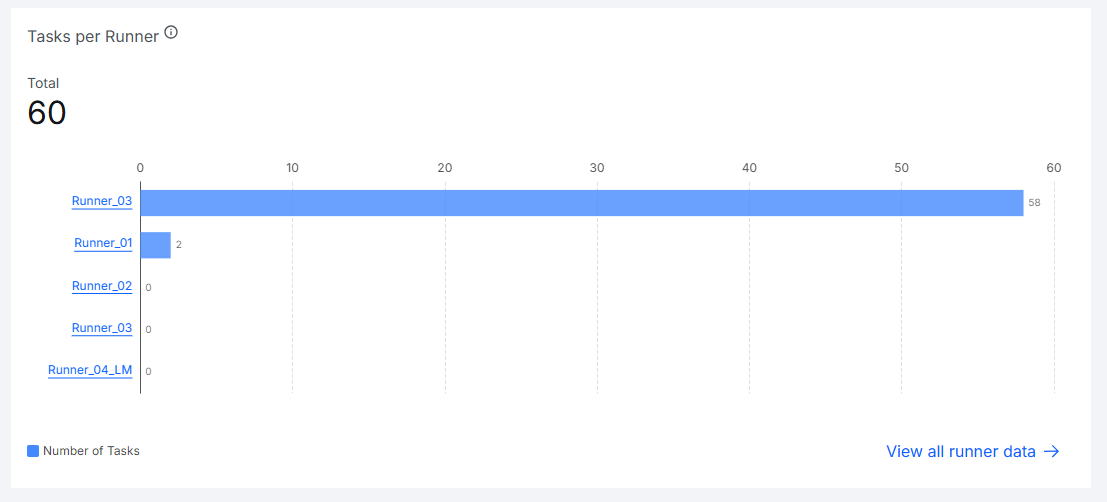
Tasks per Runner
Shows the total tasks in the selected period.
Below the indicator, a horizontal bar chart shows the top 5 Runners with the highest volume of tasks executed, allowing you to identify overloaded or underutilized Runners and support load redistribution decisions.
Runner name: Link that directs to the tasks menu filtered by the Runner.See all Runner data: Link that directs to the Runners menu in the Orchestrator.
Filters
You can combine several filters at the top of the Automations tab to search according to your needs.
Available filters:
- Automation: Select one or more automations, with search available.
- Date: Default:
last month. Options:Today,1 day,1 week,15 days,1 month,6 months,custom. - Repository: Select a specific repository, with search available.
Filter persistence
Selected filters remain applied when navigating between the Operations Center tabs, preserving the context of your analysis.
Period
In the Automations tab, the searched period is always a maximum of 6 months.