Dashboard
The BotCity Insights Dashboard brings together the strategic and outcome data of your hyperautomation initiative. In addition to the current value of each indicator, the page shows how it evolves over time, so you can track trends and support decisions, such as in periodic results review meetings.
Data inputs
For the Dashboard to display relevant data, you must first configure and enter the information used in the calculations.
See more at:
The Dashboard is organized into the following areas:
- Consolidated cards: Total savings, ROI, Hours saved, and FTE in the filtered period.
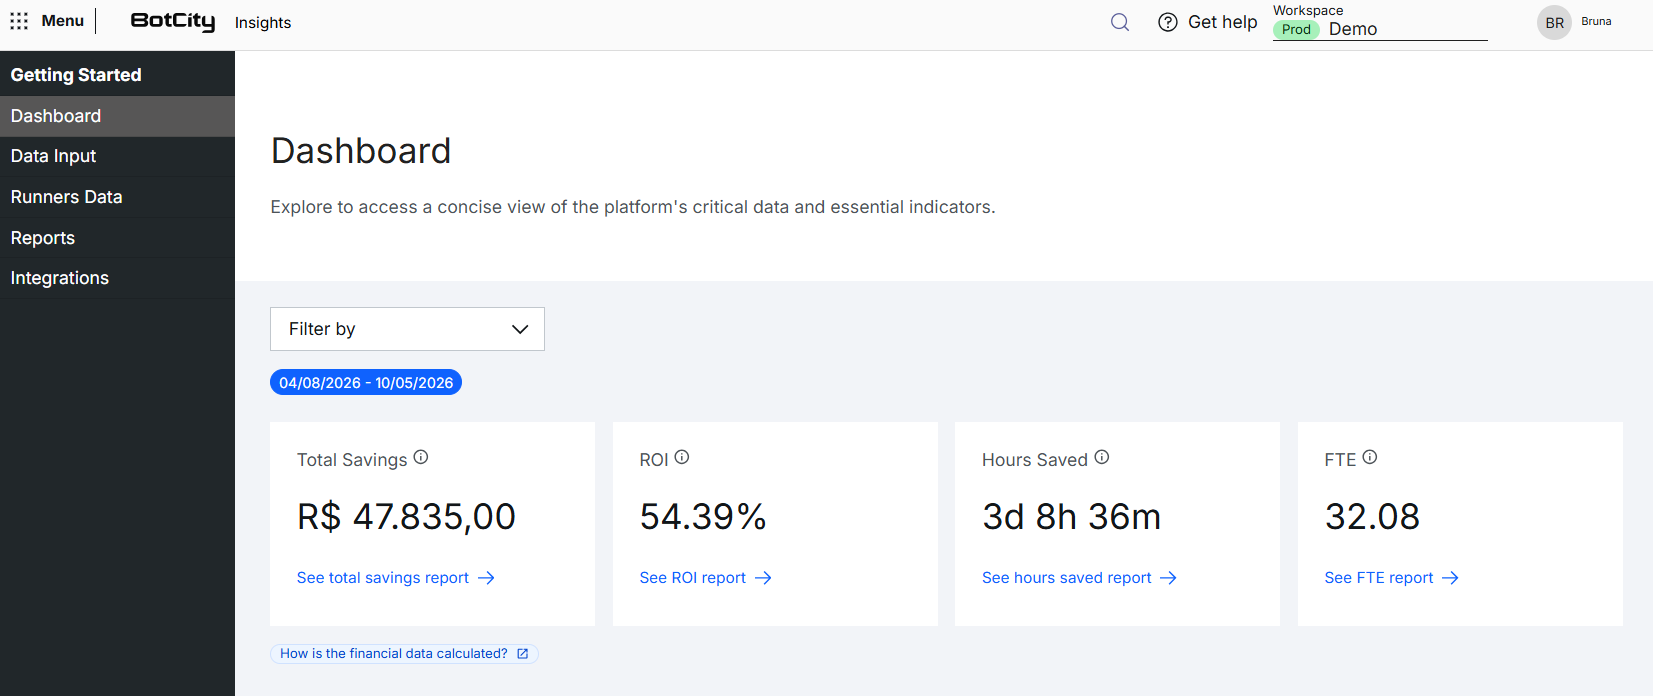
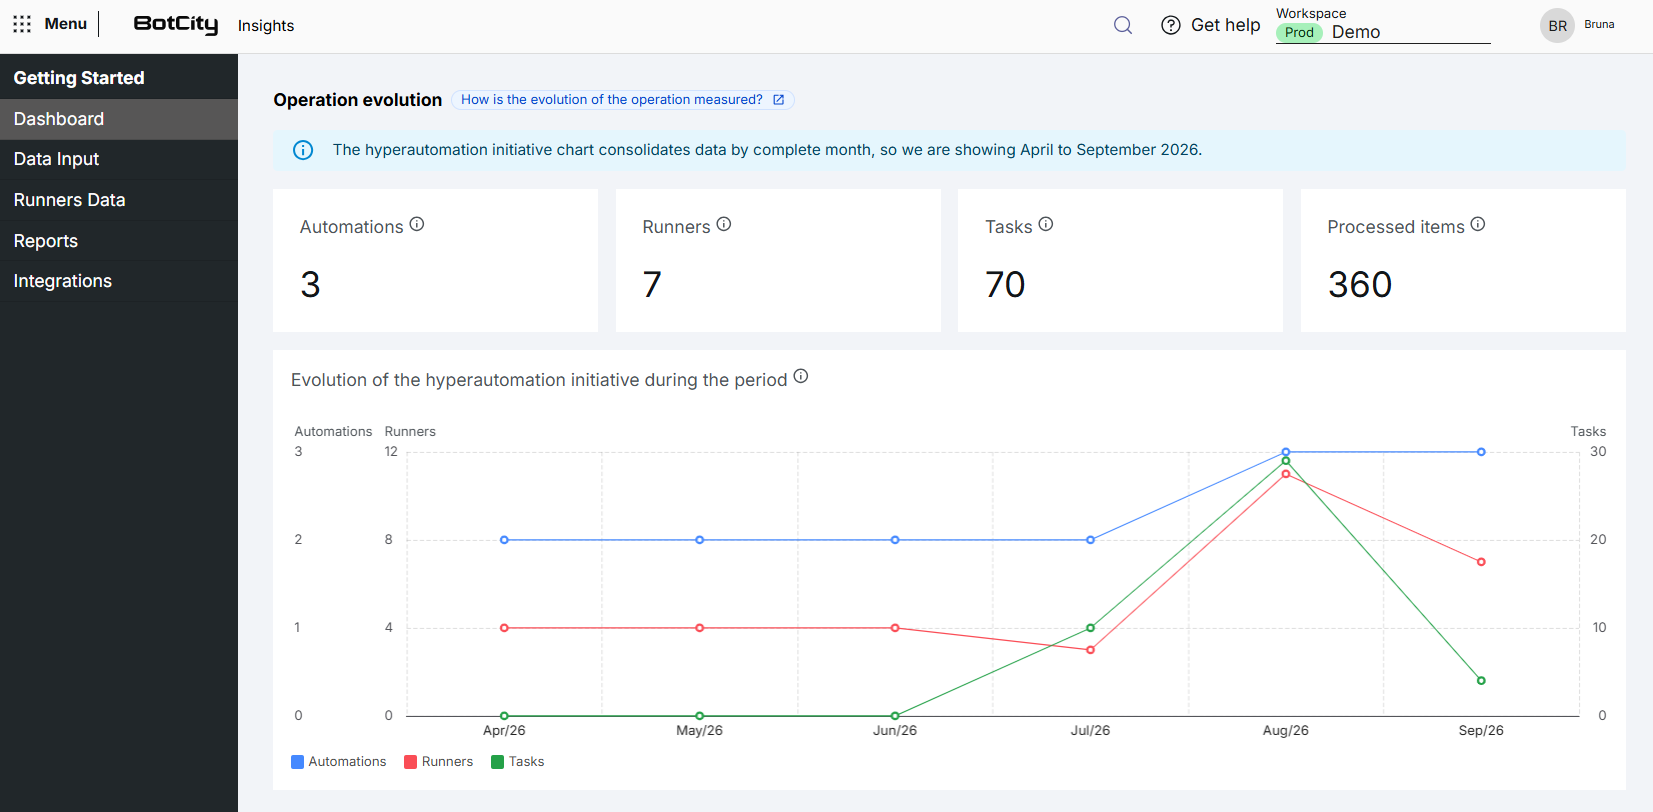
- Operation evolution: overall numbers and evolution of the hyperautomation initiative.
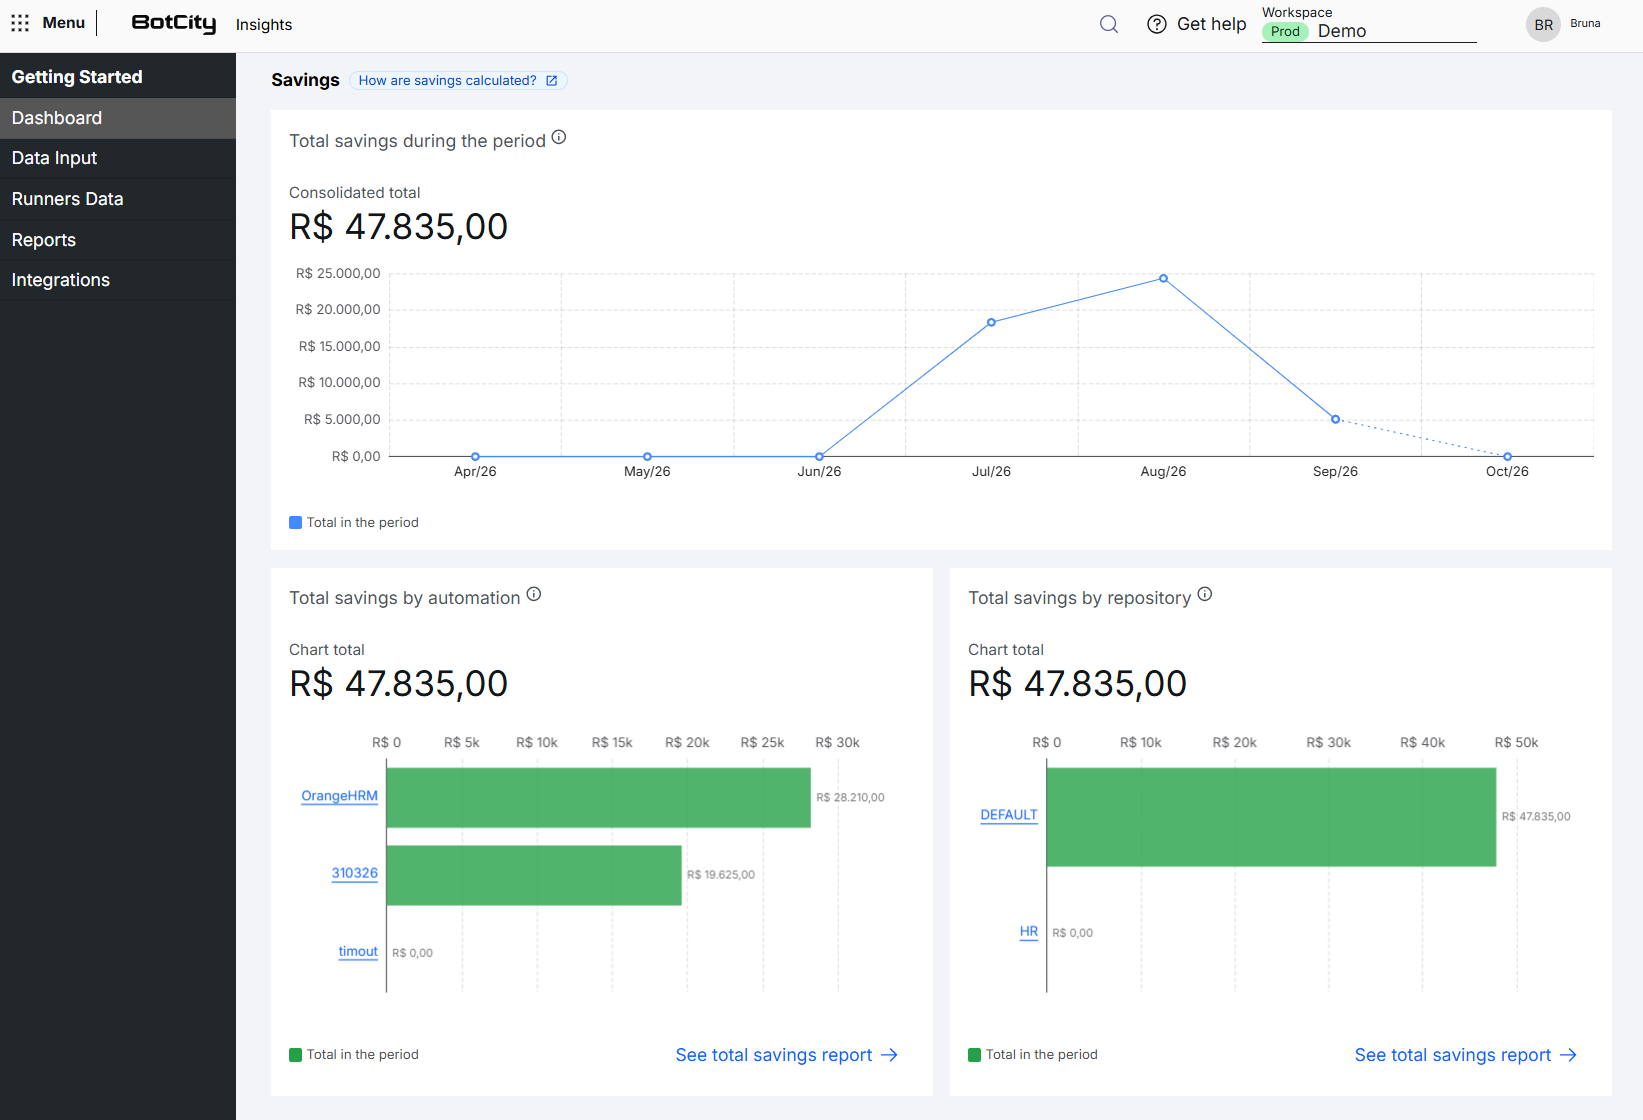
- Metric sections: details of Savings, ROI, Hours saved, and FTE, with consolidated charts and charts by automation or repository.
Consolidated cards
At the top of the Dashboard, four cards display the totals for the period and the applied filters:
-
Total savings: financial benefit obtained with the automations.
The Total Savings calculation does not take into account the investment value, but rather the human cost of each processed item.
-
ROI: return on investment in automation.
-
Hours saved: hours of human work replaced by the automations.
The result represents the total number of hours humans would spend to process the same number of items that the bots executed.
-
FTE: equivalent in full-time professionals.
Reports and calculation formulas
Each card has a See report link that takes you to the corresponding report.
See more at:
Financial data calculations
The financial indicators of the Dashboard are calculated automatically from the information registered in Data Input for each Automation, which is:
- Human time per item: The time a human would take to process a single item of the automation.
- Human cost per item: The cost of each item processed by a human.
- Investment: Investment value related to the initial cost of implementation and maintenance of the automation.
The values consider the period and the filters applied in the Dashboard.
Item count
The number of processed items is reported by the code of each automation, when finishing the task with the finish_task method of the BotCity Maestro SDK.
See more at:
- Getting Started: how to report items in a new automation.
- I already use BotCity: how to update the code of an existing automation to report items.
Total savings
Refers to the quantifiable financial benefit obtained with the implementation of the automation, including all direct and indirect cost reductions resulting from it.
How is Total savings calculated?
The Total Savings calculation is based on the following formula:
Note: The Total Savings calculation does not take into account the investment value, but rather the human cost of each processed item.
ROI
Abbreviation for "Return on Investment". This indicator measures the efficiency and profitability of an automation investment, displaying the rate of financial benefit obtained in relation to the implementation and maintenance cost of the solution.
How is ROI calculated?
The ROI calculation is based on the following formula:
Note: when the investment is greater than the total savings in the period, the ROI is negative.
Hours saved
Represents the total hours of human work replaced by the automation. This indicator quantifies the time people would need to manually perform the same tasks executed by the robots.
How are Hours saved calculated?
The Hours Saved calculation is based on the following formula:
Note: The result represents the total number of hours humans would spend to process the same number of items that the bots executed.
FTE
Abbreviation for "Full-Time Equivalent". This indicator measures productivity by comparing the number of items a robot processes with the number of items a person would process in the same period.
How is FTE calculated?
The FTE calculation is based on the following formula:
Operation evolution
This section shows the growth of the hyperautomation initiative as a whole. It contains:
- Automations: total number of complete automations on the platform.
- Runners: total number of Runners created on the platform.
- Tasks: number of tasks executed.
- Processed items: number of items processed by the tasks.
- Chart: cumulative number of Automations, Runners, and Tasks executed in production over time.
Metric sections
The Dashboard presents one section for each metric:
- Savings
- ROI
- Hours saved
- FTE
Each section contains:
- Consolidated chart: line chart with the evolution of the metric in the filtered period.
- By automation: horizontal bar chart with the 5 automations with the highest value in the metric.
- By repository: horizontal bar chart with the 5 repositories with the highest value in the metric.
Update time
Insights data is recalculated every hour, so newly reported values may take some time to appear. This page does not refresh automatically, so reload it whenever necessary.
Top 5 in the bar charts
The charts by automation and by repository display up to 5 items, sorted by the metric value. If you select more than 5 automations in the filter, the charts show the 5 with the highest value among the selected ones.
Chart total and consolidated total
The Chart total corresponds to the sum of only the items displayed in the bar chart (up to 5). The Consolidated total at the top, on the other hand, sums all the automations or repositories included in the filter. For this reason, the two values may differ.
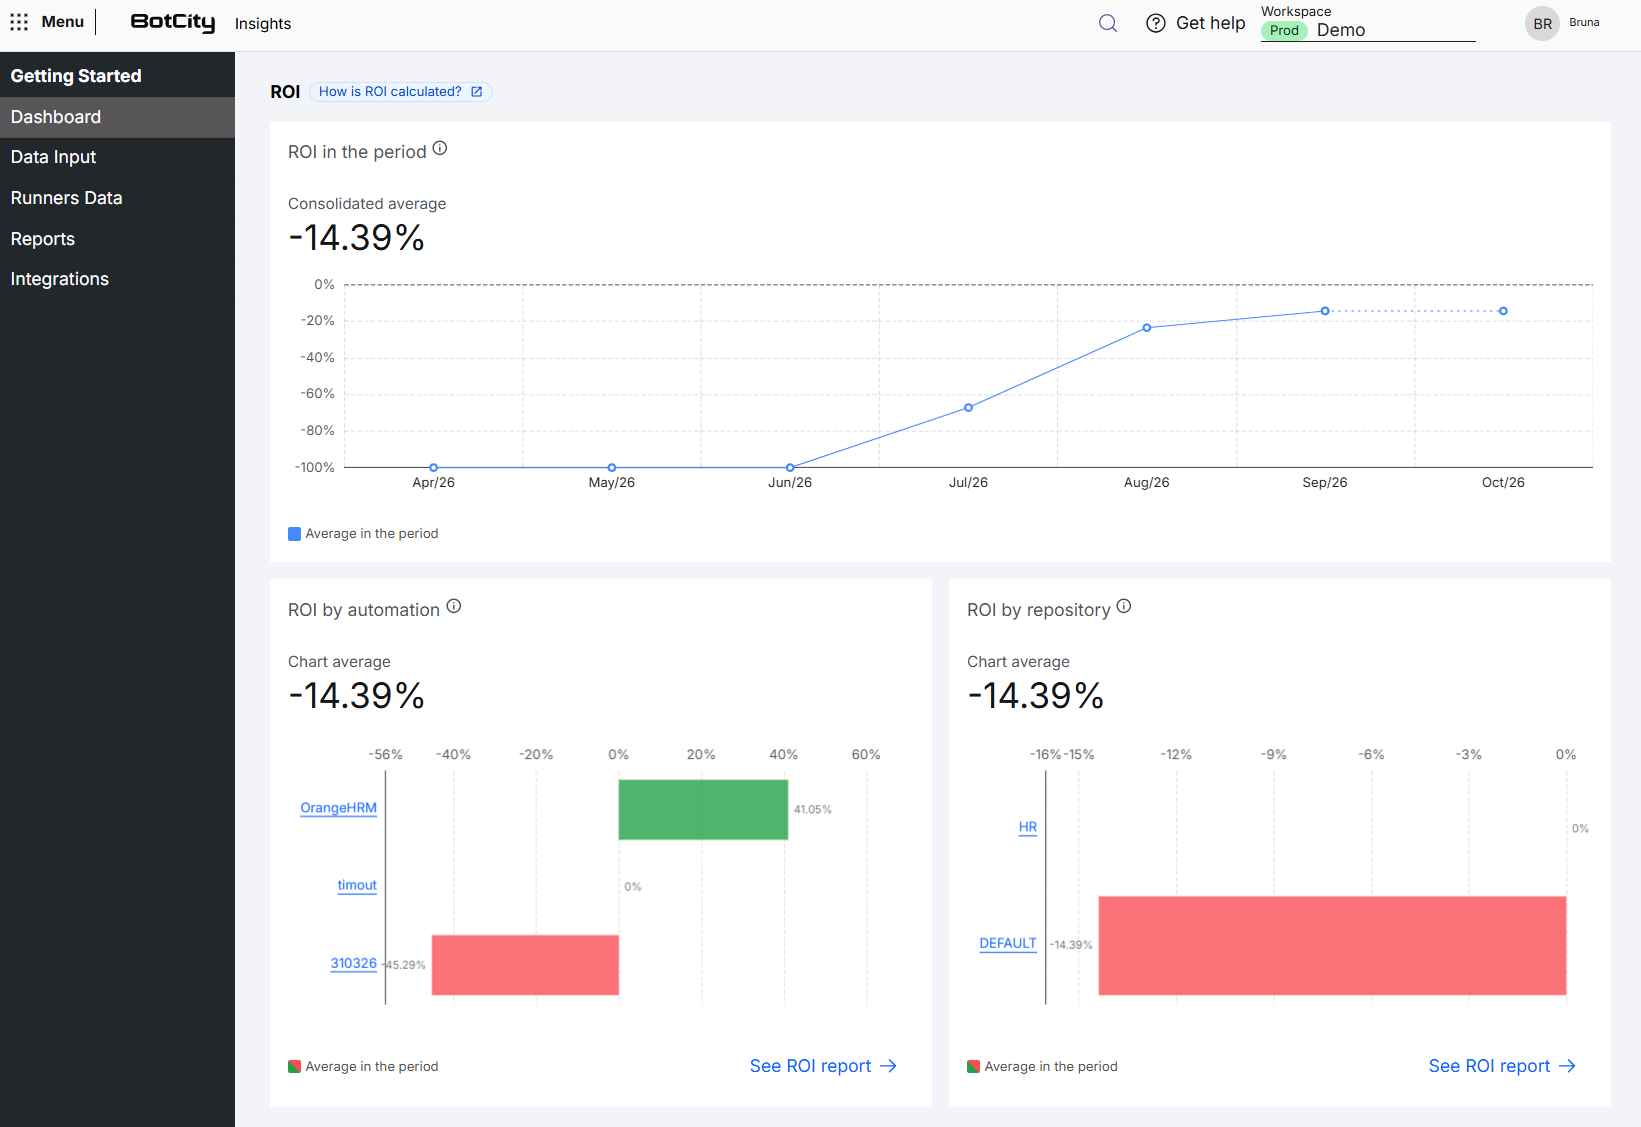
Negative ROI
ROI can have negative values, both in the consolidated chart and in the charts by automation and by repository.
In this case:
- A dotted line marks the zero value in the consolidated chart.
- The axis scale is adjusted to the highest value on each side, so the positive and negative parts may have different sizes.
- Green bars represent positive ROI and red bars represent negative ROI.
Filters
You can combine filters in the Dashboard to analyze the data according to your needs.
Available filters:
- Period: Selects a predefined period or a custom period.
- Automation: Selects one or more automations.
- Repository: Selects a repository.
The automation and repository filters cannot be used at the same time.