Reports
In the Reports section, you analyze specific data about the workspace's automations, tasks, and Runners, and export the information for further analysis.
The available reports are:
- ROI, FTE and Savings: financial indicators for each automation.
- Runners: workload and utilization rate of each Runner.
- Automations: tasks and items processed per automation.
- Tasks: list of executed tasks, with state and processed items.
- Success rate: proportion of items processed successfully per automation.
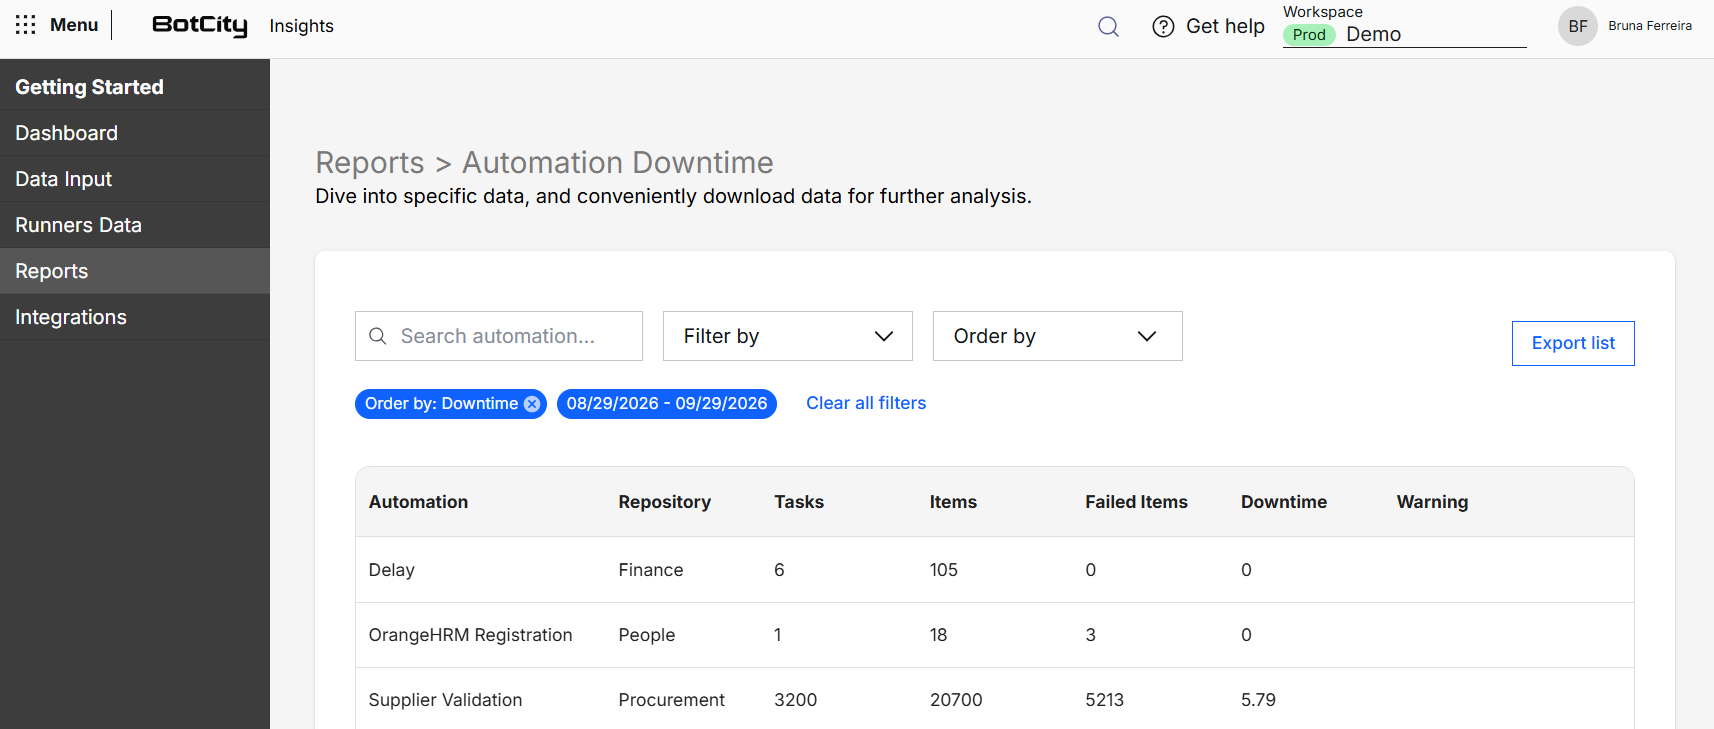
- Downtime: time spent on items that failed, per automation.
To open a report, click Go to the list on the corresponding card.
Data input
The financial reports depend on the values configured in the Data Input section. Configure the values for each automation before analyzing the reports.

Search, filters, and export
All reports share the same controls, located above the table.
Search by:
- Automation: searches by automation name. In the Runners report, the search is by Runner name.
Available filters:
- Repository: selects a repository.
- Period: selects the date range of the displayed data.
Sorting:
- Order by: sorts the table by one of the report columns, such as:
Success RateRunnerDowntime
The applied filters and sorting appear as tags below the fields. To remove an item, click the x on the tag. To remove all of them, click Clear all filters.
- Export list: the
Export listbutton downloads all data. It takes into account the date and automation filters. - Last update: the table footer shows the date and time of the last data calculation. Insights data is recalculated every hour.
ROI, FTE and Savings
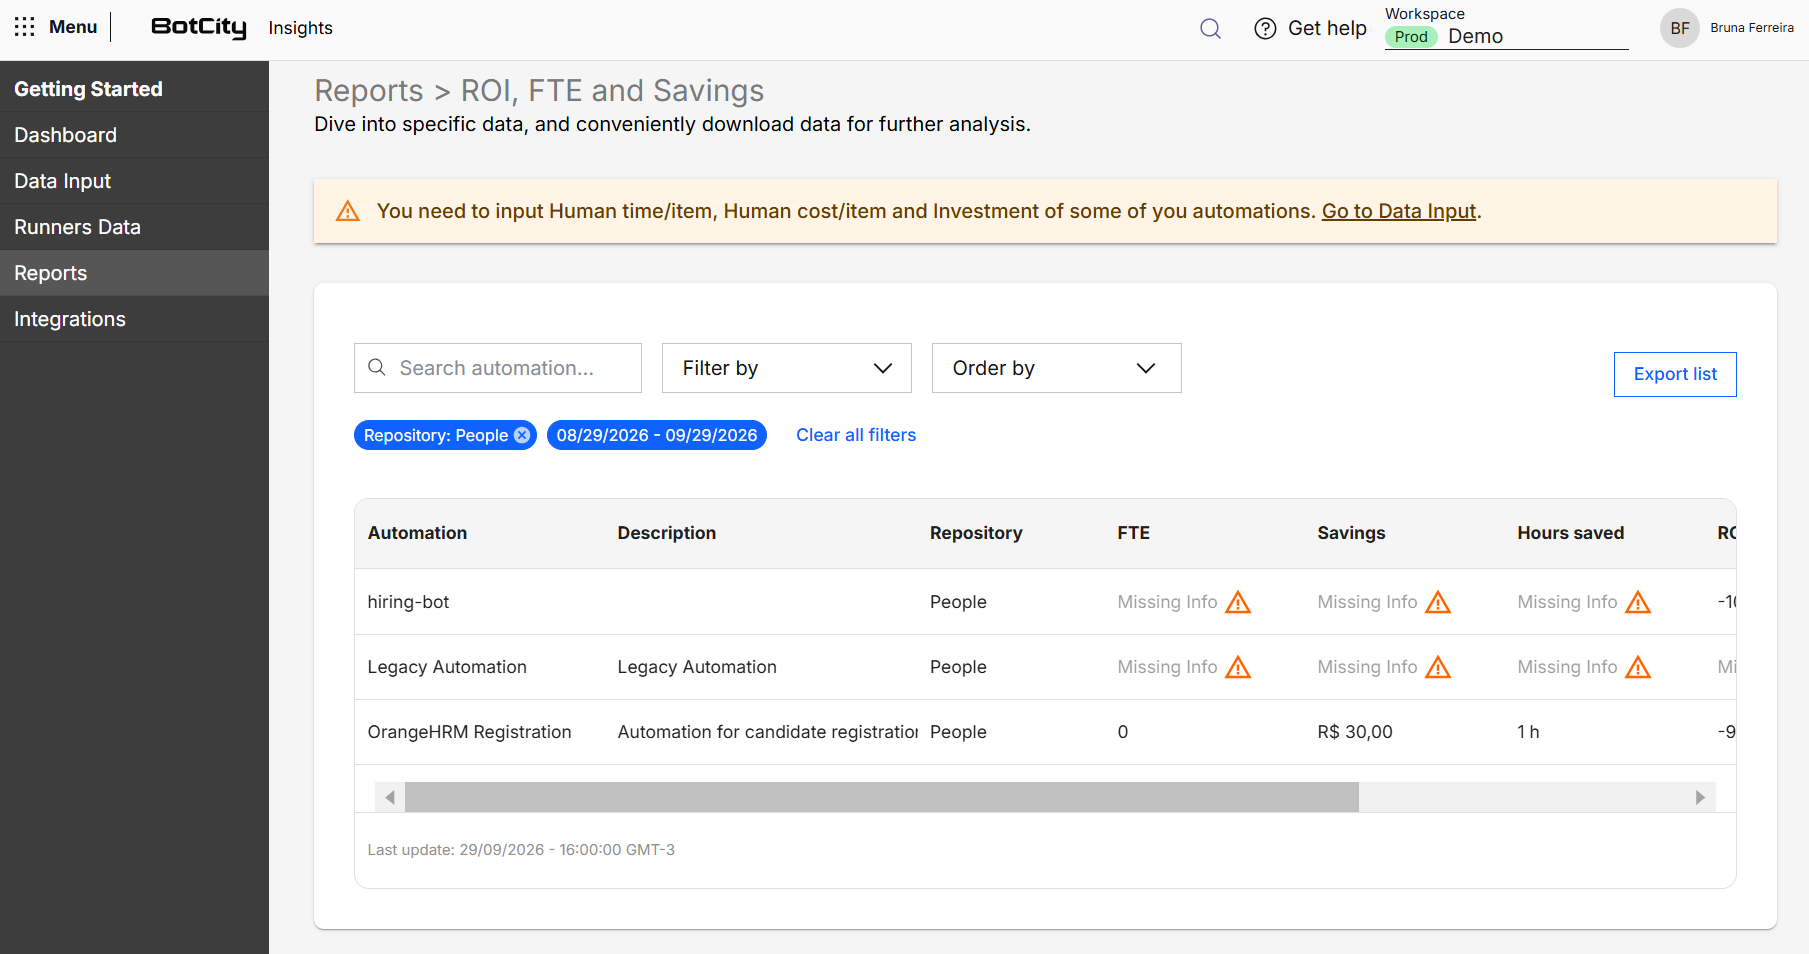
Shows the financial indicators of each automation in the filtered period:
- Automation: automation name.
- Description: description registered for the automation.
- Repository: repository the automation belongs to.
- FTE: full-time equivalent professionals.
- Savings: financial benefit obtained with the automation.
- Hours saved: hours of human work replaced by the automation.
- ROI: return on investment, which can have negative values.
Missing information
When an automation does not have the Human time / item, Human cost / item, and Investment values filled in, the report displays a warning at the top of the page and the Missing Info indication in the columns that depend on these values. Click Go to Data Input in the warning to fill in the values.
See more in:
Runners
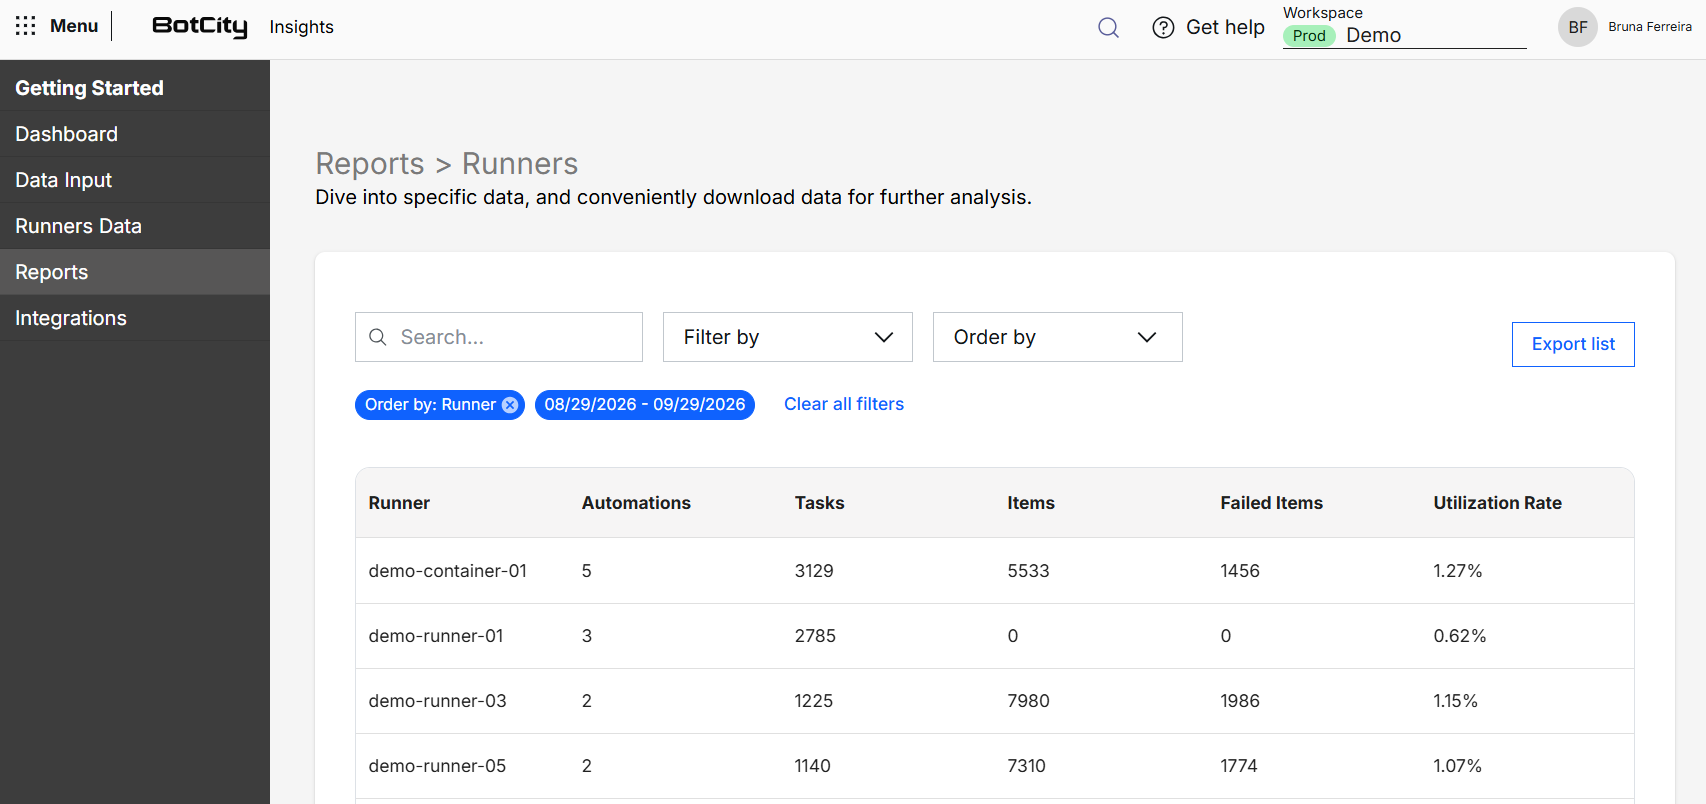
Shows the workload of each Runner in the workspace in the filtered period:
- Runner: Runner name.
- Automations: number of automations executed by the Runner.
- Tasks: number of tasks executed by the Runner.
- Items: number of processed items.
- Failed Items: number of items processed with failure.
- Utilization Rate: percentage of time the Runner was executing tasks.
Automations
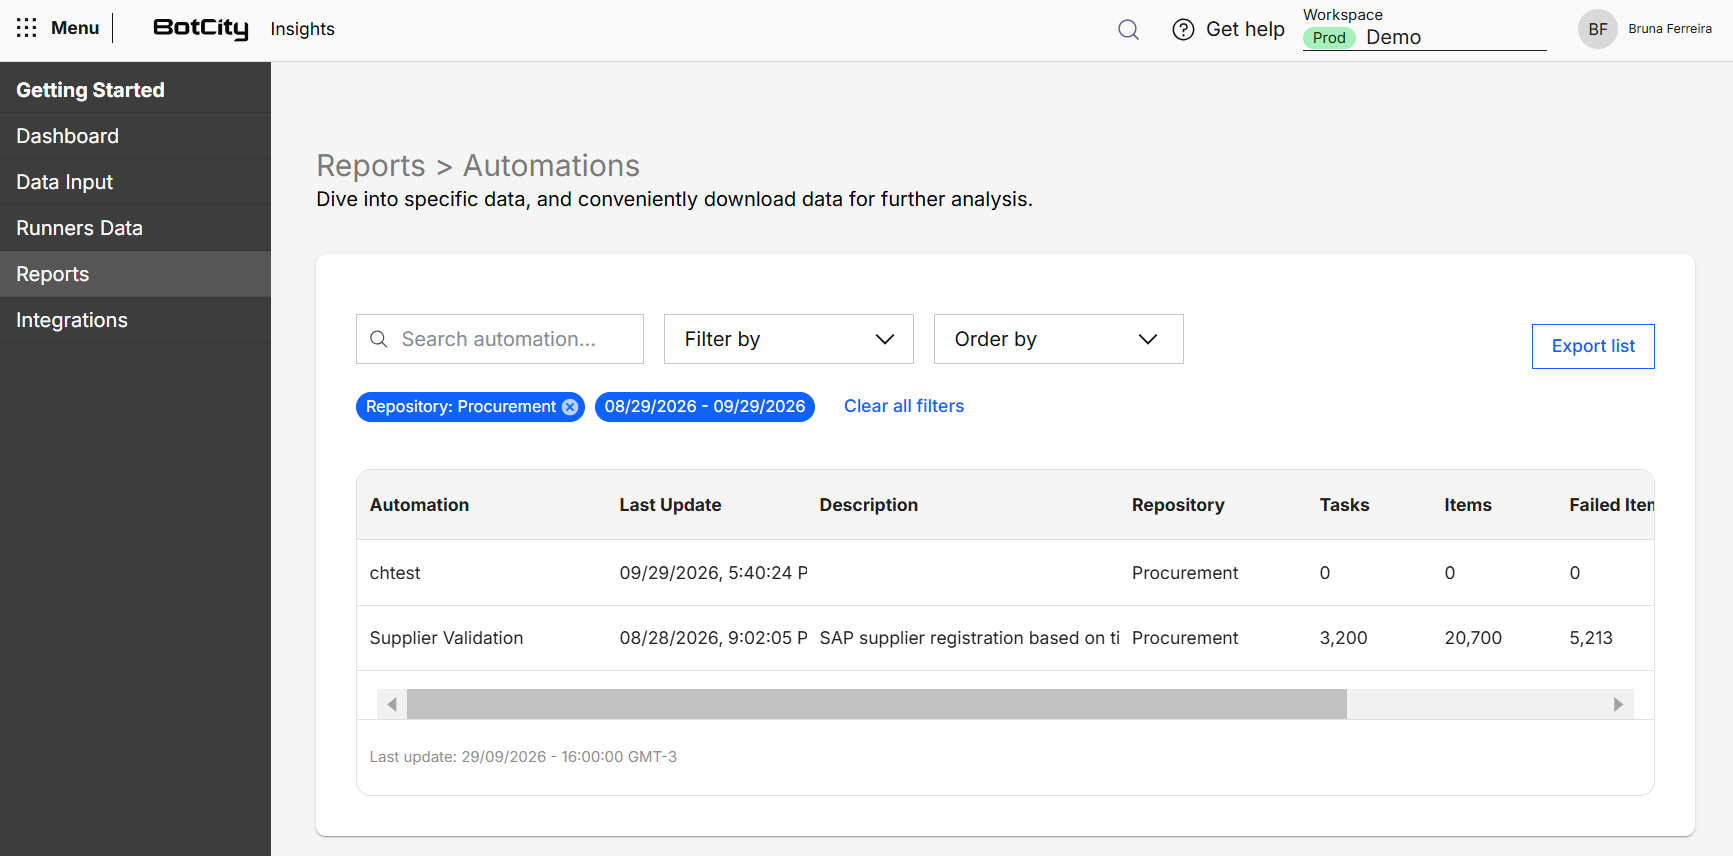
Shows the volume of tasks and items of each automation in the filtered period:
- Automation: automation name.
- Last Update: date and time of the automation's last update.
- Description: description registered for the automation.
- Repository: repository the automation belongs to.
- Tasks: number of executed tasks.
- Items: number of processed items.
- Failed Items: number of items processed with failure.
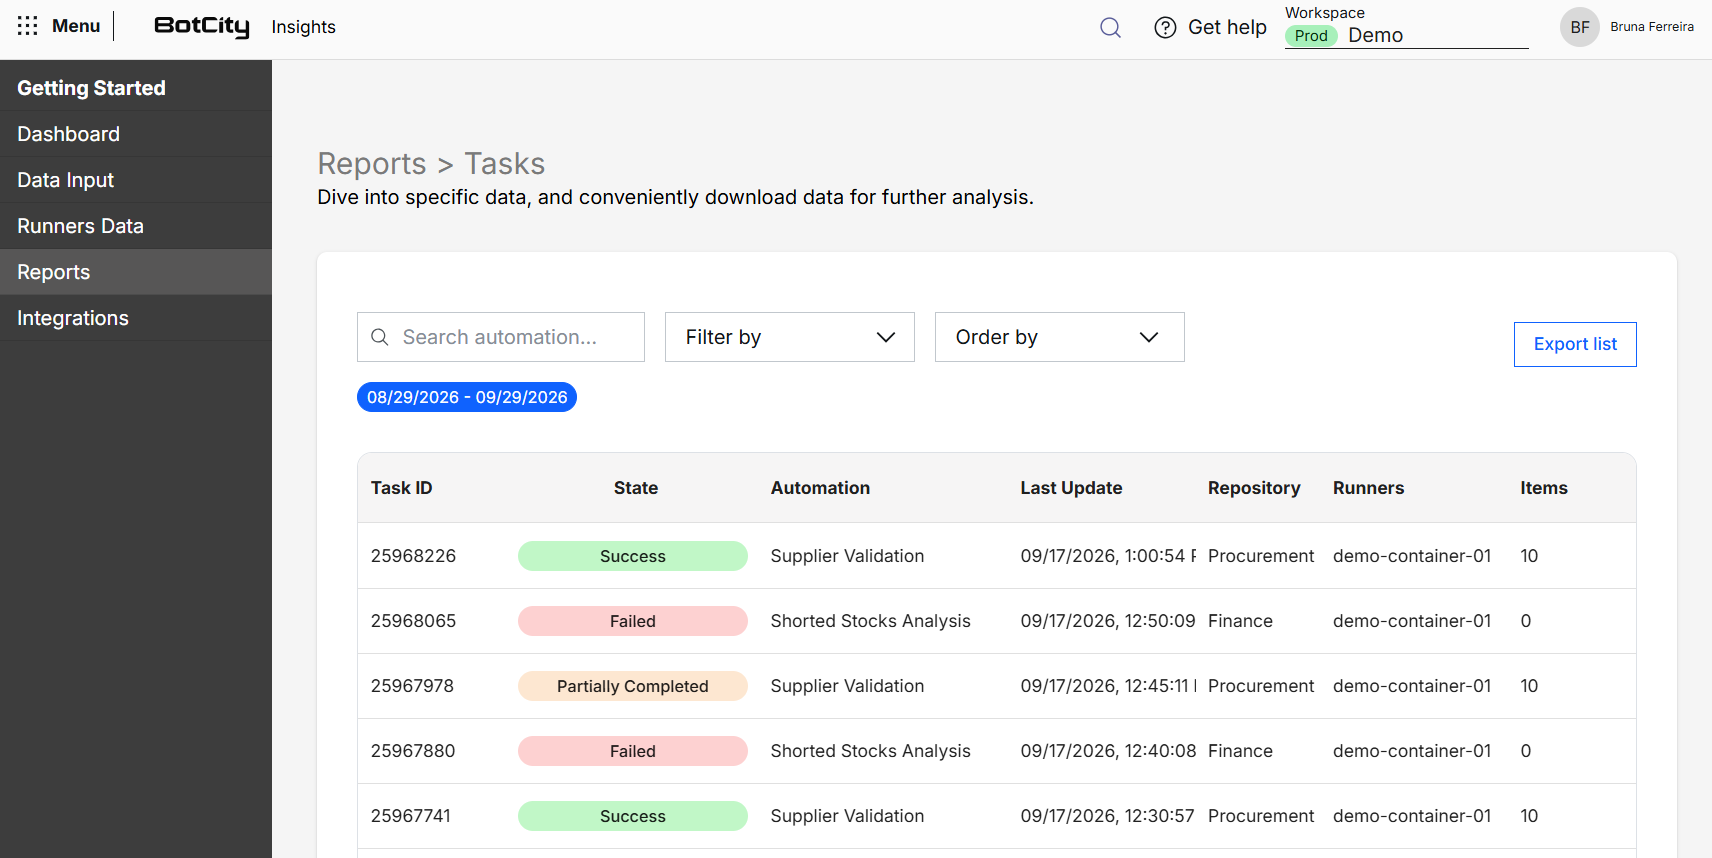
Tasks
Shows the tasks executed in the filtered period:
- Task ID: task identifier in the Orchestrator.
- State: execution result, which can be:
SuccessFailedPartially Completed.
- Automation: automation the task belongs to.
- Last Update: date and time of the task's last update.
- Repository: automation repository.
- Runners: Runner that executed the task.
- Items: number of items processed by the task.
Success rate
Shows the proportion of items processed successfully in each automation in the filtered period:
- Automation: automation name.
- Repository: repository the automation belongs to.
- Tasks: number of executed tasks.
- Items: number of processed items.
- Failed Items: number of items processed with failure.
- Success Rate: percentage of items processed successfully relative to the total number of items.
- Warning: indicates when there is a note about the automation data.

Downtime
Shows the time spent processing items that failed in each automation in the filtered period. The higher the value, the more execution time was consumed by failed items.
- Automation: automation name.
- Repository: repository the automation belongs to.
- Tasks: number of executed tasks.
- Items: number of processed items.
- Failed Items: number of items processed with failure.
- Downtime: time spent processing the failed items.
- Warning: indicates when there is a note about the automation data.